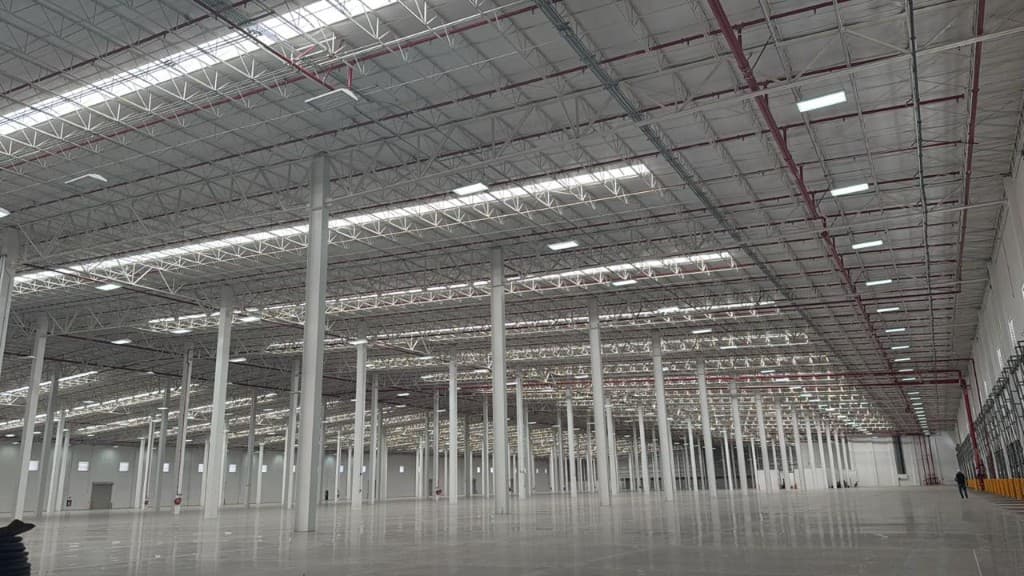
Skip to content
uRoutes · software ecosystem

From the warehouse to last mile on one data thread.

More than square meters and trucks: a closed information loop. We capture signal in the field and warehouse, consolidate it, interpret it, and return it as clear decisions: routes, locations, counts, completed deliveries, and alerts.

Explicit operating goal: on time, complete, damage-free, with inventory accuracy under control — and the fewest moves possible (fewer forklift trips, fewer round trips, fewer picking errors).

Technology reduces friction, prevents rework, and makes predictable what logistics often handles reactively.

Three uRoutes programs — WMS, TMS, and CRM — and three ways to contract: 3PL warehousing, 3PL distribution, or software only. With Silodisa warehousing or transport, all three programs ship in the same contract and platform license can be $0; what we quote by volume is moves, route destinations, cycle-count positions, etc. — not “buying CRM separately.” Standalone rental uses monthly license plus the same operational usage per the catalog.

The three programs

WMS, TMS, and CRM — what each one is, and why uRoutes

No “enter technology and guess.” These are three products we run every day in our DCs and on real routes: inventory lives where product moves, routing is solved with OR-Tools, and the customer sees proof on the same dataset — not a parallel spreadsheet.

  • WMS

    Warehouse Management System

    The system that governs DC floor operations: locations, inbound, outbound, cycle counting, inventory accuracy (IRA), and who is allowed to do what. Without a serious WMS, traceability does not hold up in an audit.

    Goods → location → order → dock

    What it covers in operations

    • Receiving, putaway, replenishment, picking, shipping, and adjustments under rules.
    • Web router and floor app: scan-and-confirm keeps the master record current.
    • Cycle counts, QA walls, and visibility for office teams and auditors.

    Why uRoutes (not a generic WMS bolted onto a different TMS)

    • Our WMS: operated in live sites; not a slide-deck implementation theory.
    • Same master data as TMS and CRM: a warehouse move links to delivery and the client view.
    • Fewer forklift miles and pick errors because rules and UI were built for high-volume work in Mexico.
  • TMS

    Transportation Management System

    Turns orders and stops into executable routes: time windows, capacity, cost per stop, control tower, and driver app. Without a TMS, transportation lives in chat threads and spreadsheets.

    Orders → route plan → execution → close

    What it covers in operations

    • Routing and re-planning; OR-Tools with real constraints (not just “draw lines on a map”).
    • Fleet, deliveries, proof of delivery, and exceptions tied to settlement.
    • Cost per route and visibility for finance and ops.

    Why uRoutes

    • A serious optimization engine (VRPTW / constraints) on the same stack as the warehouse.
    • Mobility and dashboards included: execute and close with evidence, not miscellaneous screenshots.
    • Fewer empty miles and retries because plan and execution share one data language.
  • CRM

    Customer view — portal and proof toward your client

    Here CRM is not “sales dialers”: it is how your client or brand sees inventory, deliveries, incidents, and KPIs — and receives defensible proof of delivery. It closes the chain with whoever buys your 3PL service.

    Ops → evidence → client view

    What it covers in operations

    • Client views (allocated, in transit, delivered).
    • Proof: geofences, signature/photo, exceptions, and an inspectable log.
    • Shared dashboards: fewer “did my order ship yet?” emails.

    Why uRoutes

    • Fed by the same WMS and TMS: no month-end CSV reconciliation theater.
    • Built for 3PL: the brand owner sees what they must audit, not cryptic internal screens.
    • Retention and renewal: operational transparency as a product, not a promise.
uRoutes · system map

Layered architecture: from the street to the rack, one dataset.

An enterprise-style logistics platform: each layer serves a different actor (truck, forklift, inventory office, brand customer, IT). Click a module to jump to its product sheet.

  1. 01Distribution
  2. 02Warehouse · floor
  3. 03Warehouse · office
  4. 04Customer / brand
  5. 05IT · integration
  6. 06Platform

Browse by operating layer

01

Distribution

Layer · Distribution (last mile)

Like TMS + VRP optimization: plan, execution on the road, and control tower.

02

Warehouse · floor

Layer · Warehouse — floor

RF / WMS mobile terminal: moves and counts with scanning.

03

Warehouse · office

Layer · Warehouse — office & engineering

IRA, cycles, slotting, and dock analytics — labor & inventory analytics.

04

Customer / brand

Layer · Logistics customer (CRM)

uRoutes CRM (read-only): your brand sees inventory, shipments, and the same truth as the floor — no rack-operator WMS login.

05

IT · integration

Layer · Integration

Operational iPaaS / API gateway: ERP, EDI, and apps against the same base.

06

Platform

Layer · Governance & access

Multi-tenant IAM + front door: fewer loose URLs and passwords.

Suggested order: (1) last-mile family → TMS; (2) warehouse family → WMS; (3) platform family → CRM (client views, proof) + integration and governance. That locates pain on the road, in the rack, or in client-facing closure.

uRoutes · product

Systems we sell — on video

Software only is the same uRoutes trio—WMS (warehouse), TMS (routes + field), and CRM (client views + evidence)—you see in the warehousing and distribution videos: web router, Mobility, optimizer, and dashboards. Click to watch full screen.

Full library by topic
uRoutes · differentiation

Differentiation

Why the difference shows

Four product decisions: instrumentation, engine, visibility, and value model — direct message with technical backing.

uRoutes · product decisions

Real instrumentation

Built for actual Mexican operations — not a US template.

Modules designed for Mexico: multi-DC, delivery windows, mixed warehouse + last mile, device-grade evidence.

Enterprise-grade routing engine

Serious optimization (CVRPTW / OR-Tools), not just “drawing on a map”.

CVRPTW and OR-Tools with refinement on real maps; cost, utilization, and sustainability KPIs when applicable.

Visibility without chasing data

What happened on the floor today shows on the dashboard today — same ledger.

Inventory, dwell, shipments, receipts, and cycle counts tied to daily operations.

Integrated value model

One ecosystem: analytics + execution; not dozens of disconnected licenses.

Analytics, optimization, and execution in one ecosystem: you pay for outcomes and continuity, not every export or “extra layer”.

uRoutes · architecture

Functional architecture

WMS, TMS, and CRM — three programs, one data thread

Warehouse floor on the WMS; route, fleet, and cost on the TMS; CRM with client views and proof toward your brand — integration and governance on the same master record.

uRoutes · product architecture

Capture

If it was not logged with time and context, for the system it did not exist.

App at dock and on the road: scan, photos, signatures, GPS, auditable events.

Calculate

Fewer kilometers and fewer blind decisions; the engine proposes, you authorize.

Optimization and analytics engines: OR-Tools routes, ABC, putaway, IRA, and suggestions.

Communicate

Same figure in control tower, management, and logistics client.

Operational dashboards, uRoutes CRM (client views and proof), exports, and alerts — the same number on the floor, tower, and customer.

Editorial frame

Note: this content is narrative and operational marketing; it does not replace technical sheets, PRDs, or contracts. Commercial figures and terms: subject to formal proposal.

uRoutes · product sheets guide

How to read each product

Start with the stack-aligned map: last mile and routing (uRoutes TMS), warehouse and inventory (uRoutes WMS), customer-facing CRM plus platform governance and integration (APIs, EDI). Each sheet includes market analogy, data flow, benefits, and explicit limitations.

Each sheet includes: operating layer (distribution / warehouse / customer), who runs it, TMS / WMS / CRM analogy, data pipe, inputs and outputs, benefits, and explicit limitations.

uRoutes · last mile
Family · Last mile

Last mile

Plan well, execute with evidence

Maps to the pricing rows for Route optimizer, Mobility app, and Deliveries dashboard — here is what each does in the Plan → Execute → Close flow.

uRoutes · PLAN · FIELD · CLOSE

Value flow

The optimizer reduces uncertainty before departure; Mobility captures reality on the road; the Dashboard closes the loop for management and logistics customer.

Product flow

PlanWeb optimizer
ExecuteMobility app
CloseDeliveries dashboard
uRoutes · product sheet

Product sheet

Web route optimizer

Generate optimal routes

DistributionRoutes, fleet, deliveries, settlement

Who uses it day to day

Transport planning / dispatch · Control tower · Who builds daily dispatch (and authorizes the plan)

How you would place it in the market

Usually grouped with “route planning”, “TMS planning”, or VRP/CVRPTW engines — not GPS tracking itself; it is the roadmap before wheels turn.

Before the first engine starts you already know how many trucks, in what order, and at what defensible cost.

What does it do? (one line)

Takes your orders and business rules and returns a route plan on a map, with sequences per truck, estimated cost, and ready to authorize and send to drivers.

What it is (detail)

Web app to load orders and destinations (e.g. spreadsheet), optimize with OR-Tools considering capacity, time windows, sequences, and pickup/delivery where applicable. You see map, costs, KPIs and authorize the plan into the mobile ecosystem; with “Google exact” flow, recalculation with more realistic legs.

How it works (steps)

  1. Import or load orders and constraints (windows, capacity, priorities).
  2. The CVRPTW / OR-Tools engine builds sequences and vehicle assignment.
  3. Review map, estimated cost (fuel, tolls, refrigeration or overnight rules per policy).
  4. Authorize the plan; it drops into Mobility as the official itinerary.

Strengths

  • Fewer kilometers and trucks for the same volume.
  • Delivery window compliance with an explicit plan.
  • Cost transparency for ops and finance.
  • Repeatable decisions: same policy, same engine.

Limits / dependencies

Operational transparency: what it does not solve alone or what must be in place for it to work.

  • Plan quality depends on clean orders and constraints (garbage in, garbage out).
  • Does not replace dock discipline or negotiate with the customer for you.
  • Without an authorized itinerary pushed to Mobility, execution on the road cannot “guess” the plan.

Impact by type

Savings / efficiency: Fewer km and unit turns → fuel, time, and wear.Better service: Windows met and fewer last-minute reschedules.Control / risk: Defensible plan: what was assumed vs. what ran (plan vs actual in Dashboard).

Money / cost

Every badly built route costs idle trucks and rework; the optimizer lets you negotiate volume and cost with a quantified baseline.

Service / operations

Your customer sees predictable fulfillment; your team stops improvising routes in Excel the same day as dispatch.

uRoutes · product sheet

Product sheet

Mobility app

Drivers on the road

DistributionRoutes, fleet, deliveries, settlement

Who uses it day to day

Drivers / operators · Control tower (live tracking) · Settlement / operational finance

How you would place it in the market

Maps to proof of delivery (PoD), driver app, or last-mile execution tied to the plan: evidence, GPS, and exceptions — not just a pretty map.

Delivery stops being “word against word”: evidence, GPS, and closeout ready for audit.

What does it do? (one line)

Runs each stop of the authorized trip on Android: captures evidence, GPS, and exceptions, and closes the trip with data ready to settle and audit.

What it is (detail)

Android app on the road: itinerary, evidence (photos, signature), settlement, expenses, periodic GPS, incidents and SOS with location. Offline-first sync where applicable so events are not lost in weak coverage.

How it works (steps)

  1. Driver receives the authorized trip from optimizer or control tower.
  2. Executes stops in order; captures proof of delivery and exceptions on site.
  3. Events upload to the core for live visibility and operational closeout.

Strengths

  • Proof of delivery and closeout with digital backup.
  • Fewer disputes with customers over deliveries or times.
  • Operator safety and visibility (incl. SOS).
  • Data ready for settlement without retyping paper.

Limits / dependencies

Operational transparency: what it does not solve alone or what must be in place for it to work.

  • Requires Android and reasonable connectivity (offline-first where applicable, but sync has limits).
  • If the base plan is wrong, the app executes a bad plan well — the optimizer still matters.
  • Not a full TMS for buying third-party freight if that is not your model.

Impact by type

Savings / efficiency: Fewer hours reconciling waybills and “did it arrive?” calls.Better service: Traceability that backs SLA and perceived quality.Control / risk: Georeferenced, auditable exceptions.

Money / cost

Cuts poorly documented returns, penalty fees, and the hidden cost of manual clarifications.

Service / operations

End customer and DC see the same progress; less friction in last mile.

uRoutes · product sheet

Product sheet

Deliveries dashboard

Delivery visibility

DistributionRoutes, fleet, deliveries, settlement

Who uses it day to day

Shipper / brand logistics · Operations management · Control tower

How you would place it in the market

Similar to control tower or executive TMS/CRM read view: analytics and tracking, not capture on the truck.

Management and shipper see operations without installing anything at the carrier.

What does it do? (one line)

Consolidates in a browser everything that happened and is happening on deliveries: live map, history, files, and plan vs actual analytics — without touching carrier systems.

What it is (detail)

Read-only web panel: live view (map, active trips), SOS alarms, authorized vs settled with rich file (operator, vehicle, destination, costs, evidence, plan vs actual, perfect order aligned to rules), analytics and exports.

How it works (steps)

  1. Mobility events and optimizer plans feed the dashboard near-real-time.
  2. Filter by state, customer, route, or exception; export for finance or quality.
  3. Authorized / settled layers separate operations from accounting closeout.

Strengths

  • Early detection of bottlenecks and recurring exceptions.
  • Plan vs execution comparison for continuous improvement.
  • Finance exports without ad-hoc IT reports.

Limits / dependencies

Operational transparency: what it does not solve alone or what must be in place for it to work.

  • Primarily analytical reading: does not replace the driver app or dock capture.
  • Dashboard freshness follows the event stream; sync gaps show as delay, not magic.
  • Does not replace a clear commercial SLA if business rules are undefined.

Impact by type

Control / risk: Single canvas for tracking and compliance.Better service: Transparency to your customer without “send me the Excel” meetings.Savings / efficiency: Less coordination time between tower, accounting, and driver.

Money / cost

Move from reactively fixing the same badly designed routes; data shows where margin leaked.

Service / operations

Delivery improvement culture: you see where failures cluster and act on evidence.

uRoutes · warehouse
Family · Warehouse & inventory

Warehouse & inventory

Accuracy, speed, and less wasted motion

In the rental catalog, the WMS — warehouse management row summarizes the operating set; below we break it down into floor terminal, dashboards, and API layer so you see what each piece does and its impact.

uRoutes · RECEIVE · INV · SHIP

Value flow

Fewer pointless walks in rack, fewer unrecorded exceptions, and inventory that matches what management sees.

Product flow

RegisterScanner app
MonitorCounts · Efficiency
ShowuRoutes CRM
ConnectAPI / Cloud
uRoutes · product sheet

Product sheet

Android Scanner app

Warehouse floor terminal

Warehouse · floorForklifts, scanning, location counts

Who uses it day to day

Forklift operators / floor staff · Dock supervisors · Inventory cycle counters

How you would place it in the market

Same role as RF terminal, handheld WMS, or task execution in major WMS suites: transactional capture at location.

The floor stops fighting Excel: guided transfers and counts cut human error.

What does it do? (one line)

Floor terminal that registers every move and count with scanning and role-based rules so system inventory matches the rack.

What it is (detail)

Android terminal in the warehouse: transfers (source, HU, destination, role rules), guarded cycle counts, task locking, and guided flows to standardize moves and cut bad relocations.

How it works (steps)

  1. Operator scans and confirms moves per rules and permissions.
  2. Cycle counts assigned by zone and cycle; system highlights discrepancies.
  3. Every move tied to user, time, and logical location.

Strengths

  • More reliable picking and putaway.
  • Sustainable IRA and count discipline.
  • Alignment between forklift operators and systems.

Limits / dependencies

Operational transparency: what it does not solve alone or what must be in place for it to work.

  • Does not fix bad masters (locations, SKUs): great scanning does not clean a dirty catalog alone.
  • Requires usage discipline; paper bypass breaks the ledger again.
  • Deep WMS functions (rebate, quality lab, advanced cross-dock) depend on what is modeled in core/API.

Impact by type

Savings / efficiency: Fewer useless forklift moves and less “lost” inventory.Control / risk: Clear audit trail of who moved what and when.Better service: Fewer mispicks from location mistakes.

Money / cost

Every hour searching racks and every emergency count is direct cost; the app contains error at the source.

Service / operations

Your inventory promise rests on process, not supervisor heroics.

uRoutes · product sheet

Product sheet

Counts dashboard

Cycle count dashboard

Warehouse · officeIRA, cycles, slotting & analytics

Who uses it day to day

Inventory management · Warehouse manager · Finance / operational audit

How you would place it in the market

Like cycle-count / IRA dashboards in WMS suites: ABC prioritization, cycle rhythm, heat maps of risk.

Floor and office share the same rhythm: where to count first and which zone is at risk.

What does it do? (one line)

Web dashboard where management and inventory see the same count progress, IRA, and heat maps to decide where to act first.

What it is (detail)

Operational web panel: occupancy and IRA KPIs, cycle count center, zone heat maps, filters by cycle and site, integrated contextual help.

How it works (steps)

  1. Scanner progress and cycle goals consolidate.
  2. Heat maps prioritize zones with discrepancy history or high rotation.
  3. Management works from the same indicators as inventory lead.

Strengths

  • Actionable visibility of count progress.
  • Clear prioritization by area.
  • Explicit communication between floor and office.

Limits / dependencies

Operational transparency: what it does not solve alone or what must be in place for it to work.

  • If the floor does not report in Scanner, the dashboard shows gaps or lag — depends on field execution.
  • Does not eliminate physical counts; it orders and focuses, not invent existence.
  • Cycle rules must be agreed (frequency, cutoffs, tolerances).

Impact by type

Control / risk: IRA visible and manageable, not just a monthly number.Savings / efficiency: Fewer line stops for “surprise” wall-to-wall inventories.Better service: Fewer stock promises that fail a customer site visit.

Money / cost

Avoid freezing operations for massive corrective counts; the cycle spreads effort.

Service / operations

Your warehouse customer trusts you because you show count discipline, not just square meters.

uRoutes · product sheet

Product sheet

uRoutes CRM — client view

CRM / read-only view for brands and clients

Customer / branduRoutes CRM — visibility and proof toward who buys your DC or 3PLWarehouse · officeIRA, cycles, slotting & analytics

Who uses it day to day

Customer or inventory owner · Logistics buyer · Auditor of your 3PL

How you would place it in the market

uRoutes CRM layer toward your customer: same function as shipper/brand visibility in 3PL (segregated reading) — not the rack operator login.

Stop proving inventory in a meeting: show it live from the same source the floor uses.

What does it do? (one line)

Publish a read-only web view of inventory and movements you agreed to show your customer or brand — same source the DC runs.

What it is (detail)

View for customer or stakeholders: inventory, receipts, shipments, dwell (e.g. dwell breakdown when support views exist), occupancy and damage indicators aligned to agreed rules.

How it works (steps)

  1. Read-only views published from the operational core.
  2. Customer queries without access to transactions or sensitive parameters.
  3. Same numbers underpin your contractual SLAs.

Strengths

  • Transparency to end customer or brands.
  • Fewer “where does this number come from?” meetings.
  • Documented basis for SLA and trust.

Limits / dependencies

Operational transparency: what it does not solve alone or what must be in place for it to work.

  • Not transactional: the customer should not move inventory from here unless you define another flow.
  • Whatever you do not agree in the data profile (which SKUs, which view) creates friction or alert fatigue.
  • Transparency also shows operational issues — an advantage if you fix them, painful if there is no process.

Impact by type

Better service: Commercial differentiation: visibility as part of service.Commercial / trust: Easier renewals and upsell when data speaks in your favor.Control / risk: Fewer informal report requests.

Money / cost

Recover key-account and sales team time by avoiding manual weekly reports.

Service / operations

Your customer senses control and professionalism; less friction in joint audits.

uRoutes · product sheet

Product sheet

Efficiency dashboard

Warehouse analytics

Warehouse · officeIRA, cycles, slotting & analytics

Who uses it day to day

Industrial engineering / CI · Warehouse manager · Warehouse planning

How you would place it in the market

Close to slotting, labor analytics, and ABC velocity sold by advanced WMS: historical data → location suggestions and internal paths.

Slotting stops being intuition: ABC, timings, and Smart Putaway suggest where each SKU should live.

What does it do? (one line)

Analyzes how the warehouse moves and suggests where to slot each SKU and which internal paths shorten distance: from history to floor tasks.

What it is (detail)

Analysis of times (storage, ship-out), ABC rotation, expiry, location scoring, recommendations, and Smart Putaway / suggested paths toward better slots without blind inventory rewrites.

How it works (steps)

  1. Fed by real movements and material master.
  2. Models weigh distance, rotation, and expiry risk.
  3. Suggestions become actionable tasks on the floor.

Strengths

  • Shorter internal cycle time.
  • Golden zone for fast movers.
  • Less distance traveled and fewer touches.

Limits / dependencies

Operational transparency: what it does not solve alone or what must be in place for it to work.

  • Suggestions are only as good as data history; cold starts need time.
  • Requires floor execution; a beautiful dashboard without completed tasks does not move pallets.
  • Does not replace physical layout engineering (aisles, new racks) — it guides, does not build facilities.

Impact by type

Savings / efficiency: More effective capacity without new square meters: same roof, better use.Better service: Orders ready faster = better fill rate to customer.Control / risk: Slotting decisions with evidence, not only the lead’s gut feel.

Money / cost

Defer or avoid physical expansion by squeezing underused slots, aisles, and bad locations.

Service / operations

The operation feels “faster” without hiring more people just to walk farther.

uRoutes · product sheet

Product sheet

Cloud Functions + API

Integration layer

IT · integrationERP, EDI, APIs & automation

Who uses it day to day

IT / integrations · ERP consultants · Internal digital product teams

How you would place it in the market

Works as an API / lightweight iPaaS tied to operations: similar to integration hub or microservices behind a cloud WMS.

Innovate in pieces without stopping operations: serverless and stable APIs.

What does it do? (one line)

Technical layer that receives authenticated calls and runs reads, writes, and batch jobs so ERP, marketplaces, and uRoutes apps speak to the same operational base.

What it is (detail)

Functions and APIs connecting apps and dashboards to the operational base (reads, transfers, reports, suggestions) in a scalable serverless model on GCP.

How it works (steps)

  1. Frontends and apps consume versioned API contracts.
  2. Functions encapsulate heavy rules and batch without one fragile monolith.
  3. Scales on demand without the client operating servers.

Strengths

  • High availability and agile deploy per module.
  • Continuous service without one fragile monolith core.
  • Base for incremental innovation.

Limits / dependencies

Operational transparency: what it does not solve alone or what must be in place for it to work.

  • Needs contract governance and testing; bad integration can duplicate orders or delay closes.
  • Not a general-purpose BI ETL — built for the logistics operating cycle.
  • Cloud cost and quotas depend on volume; size with IT.

Impact by type

Scale / integration: Grow transaction volume without redesigning everything each year.Control / risk: More predictable ERP/marketplace integrations.Savings / efficiency: Lower cost to maintain ad-hoc point-to-point integrations.

Money / cost

Fragile systems show up as month-end closes running late and duplicate orders.

Service / operations

Time-to-market for a new channel or rule drops because the platform extends via APIs.

uRoutes · platform
Family · Governance

Governance & platform

CRM toward your customer, scale, and a single front door

Home for uRoutes CRM (client views, proof) plus governance: the APIs + EDI + integration row covers the technical layer; Admin and Hub unify access.

uRoutes · IAM · HUB · INTEGRATION

Common foundation

Orderly onboarding, multi-company without credential chaos, and a single entry point to modules.

Product flow

AdministeruRoutes Admin
EnterCentral Hub
uRoutes · product sheet

Product sheet

uRoutes Admin

Central administration

PlatformUsers, permissions & single entry

Who uses it day to day

Platform admin · IT · L2 support · Basic access compliance

How you would place it in the market

Same idea as tenant admin / IAM tied to the product: org onboarding, users, roles, and audit trail.

Multi-company onboarding without chaos of shared users or passwords in Excel.

What does it do? (one line)

Panel to onboard organizations (tenants), users, and roles, with audit of who changed what: access governance for the ecosystem.

What it is (detail)

Web panel for companies, users, audit log, and central configuration (tenant, project credentials, etc.).

How it works (steps)

  1. User add/remove with roles mapped to each module.
  2. Change log for support and basic compliance.
  3. Clean separation between orgs in the same ecosystem.

Strengths

  • Orderly onboarding for new sites or subsidiaries.
  • Access traceability.
  • Operational scale without multiplying “local admins”.

Limits / dependencies

Operational transparency: what it does not solve alone or what must be in place for it to work.

  • Does not replace corporate SSO if it demands full SAML — architecture must align.
  • Bad role hygiene expands risk surface; needs process, not only tooling.
  • Multi-country scale needs clear tenant and data definition.

Impact by type

Control / risk: Identity and permission governance without improvisation.Scale / integration: Replicate model to new DCs or countries with a clear template.Savings / efficiency: Fewer security incidents from poorly managed credentials.

Money / cost

One badly granted access incident can cost more than a year of centralized admin discipline.

Service / operations

Support and operations know who can do what; fewer ambiguous tickets.

uRoutes · product sheet

Product sheet

Central Hub

Single sign-on experience

PlatformUsers, permissions & single entry

Who uses it day to day

Any business role · Users tired of memorizing five URLs

How you would place it in the market

Like a corporate launcher or single SSO entry to uRoutes (WMS, TMS, CRM): one access point to authorized modules.

Users stop losing half the day jumping URLs and different credentials.

What does it do? (one line)

After one authentication, Hub takes you to optimizer, dashboards, warehouse, or analytics by role — without memorizing five different sites.

What it is (detail)

Unified entry to modules (delivery router, warehouse, visibility, warehouse optimization, etc.) in uRoutes7+-aligned deployments. One login, coherent experience.

How it works (steps)

  1. Centralized authentication to each authorized application.
  2. Navigation by role: each profile sees what it needs.
  3. Reduces perceived fragmentation (“tool zoo”).

Strengths

  • Less friction for end-user adoption.
  • Organization projects a single platform.
  • Less support for “what URL do I use?”.

Limits / dependencies

Operational transparency: what it does not solve alone or what must be in place for it to work.

  • Does not replace training: users must know what each module does.
  • If Admin is messy, the menu shows logical chaos.
  • Depends on each app being online; Hub does not fix downstream outages.

Impact by type

Better service: Higher time-to-productivity for new users.Control / risk: Less risk surface from passwords on sticky notes.Savings / efficiency: Recovered internal support hours.

Money / cost

System fragmentation is paid in training hours and process errors; Hub reduces both.

Service / operations

People describe the tool as “uRoutes”, not five different product names.

uRoutes · next step

Ready for the next step?

Schedule a logistics maturity diagnostic: no giant project commitment on day one. We show how each module fits your operation.

Book a conversation
uRoutes · price list

Commercial

uRoutes cost reference (MXN)

All figures in Mexican pesos (MXN), plus VAT. With Silodisa warehousing or distribution, WMS, TMS, and CRM are included in the service bundle and platform license can be $0; operating usage (moves, cycle-count position reads, route destinations, etc.) is quoted by volume — not a separate “CRM module” charge. Software-only mode uses license plus the same usage scheme per the table.

Go to cost estimator (warehouse, routes, and software)

uRoutes · cost reference

Software only

Monthly license in MXN per module; operating usage (moves, cycle-count reads, route destinations) is billed separately.

With Silodisa warehouse / routes

$0 WMS/TMS/CRM platform license with service; we bill internal moves, position reads, and destinations (with/without coordinates) by usage.

Integration

APIs, EDI, and connectors so ERP and channels talk to uRoutes with data governance.

Commercial reference — same numbers as the price table

ModuleMonthly licensesoftware only (MXN)Variable usageMXN / eventWith Silodisa servicelicense vs. usage
WMS — warehouse management$32,000 MXN/moInternal move $3/move · Position read (cycle count) $1/pos.$0 platform license with Silodisa warehouse · Internal moves and position reads billed by usage
Route optimizer$24,000 MXN/moDestination $25 (with lat/long) · $30 without coordinates · Calc-only $2 · $3 without coords.$0 license with Silodisa distribution · Usage per destination in the plan (operations or reference calculation only)
Mobility driver app$1,890 MXN/moDelivery destination $20 (with lat/long) · $25 without coordinates$0 license with Silodisa route operations · Usage per destination served with the app
Deliveries dashboard$9,200 MXN/moIncluded at $0 with service contract · No charge for operational views
Counts dashboard$7,800 MXN/moIncluded at $0 with service contract
Efficiency dashboard$10,400 MXN/moIncluded at $0 with service contract
uRoutes CRM — client read-only view$4,500 MXN/moIncluded at $0 with Silodisa service (read-only CRM view for your customer)
APIs + EDI + integration$28,500 MXN/mo$0.14/API call (machine events and queries)Integration package by scope; many projects are included in service go-live

All figures in Mexican pesos (MXN), plus VAT. Internal WMS move: handling a load unit between dock and location. Cycle count: charge per position read or confirmed in location inventory. Routing is billed per destination included in the period: higher rate if the stop lacks lat/long; Mobility or delivery-app channels use the mobile tariffs; “calculation-only” quotes only the reference plan destinations (not the same operational billing structure). Formal proposal subject to volume and SLA.

Integrated estimator · MXN + VAT

Reference costs and pricing

Four views: physical warehouse, distribution (freight + routing tech), uRoutes software by taxonomy, and consolidated summary. Use each tab independently for what you want to quote.

1 · Physical warehousing (DC)

Warehouse rates, pallet inbound, and logistics moves. Does not include uRoutes WMS license — use the Software tab for that.

Warehouse estimate (ranges)
Storage · DryMX$25,000 – MX$34,500 /mo
Pallet inboundMX$5,600 – MX$7,512 /mo
Monthly subtotalMX$30,600 – MX$42,012
Total 1 month (cumulative)MX$30,600 – MX$42,012
uRoutes · commercial fit

Fit

Who is software rental for?

Three typical profiles. If one fits, the next step is a short conversation with a focused demo.

uRoutes · rental profiles

You run your own warehouses

WMS, counts, and uRoutes CRM toward your customer without building a generic 3PL.

Inventory accuracy, floor efficiency, and visibility for your buyer — the same data in rack and on screen.

You own the fleet

Route plan, mobile execution, and delivery closeout in one story.

From optimizer to driver to dashboard: fewer “has it left yet?” calls.

You integrate ERP or marketplaces

Synchronized events and masters — fewer Excel bridges and double entry.

Serverless layer and API contracts meant for production, not just demos.

Request a focused demo

uRoutes · demo request

Demo & contact

We show real flows based on your priority product family.

Quote and contact requests are handled by Rebeca.

By submitting, you agree to the processing of your data under our privacy notice for follow-up. Use of the site is governed by our terms of service.

No commitment · response within 24h
Videos · Silodisa

Clear videos about how we operate

Introduction, WMS (warehouse), receiving, dispatch, TMS (distribution), CRM (client), deliveries, and more. Click to watch full screen.

View full library